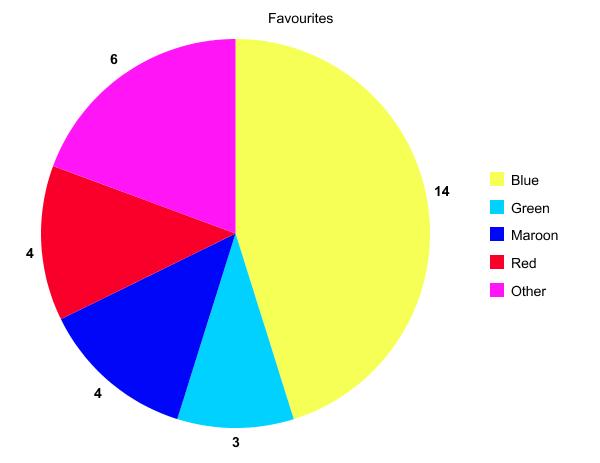
In my class we were creating graphs about every person in our class what their favourite food , program, animal,sport and color. As you can see the most colour that has been chosen the most was BLue. Half of the class love blue.
In class the lowest colour in class 2 is green. SO.. that is kind of a shame to hear that. I loved green when I was little but now as I saw red. I knew that was my favourite colour.
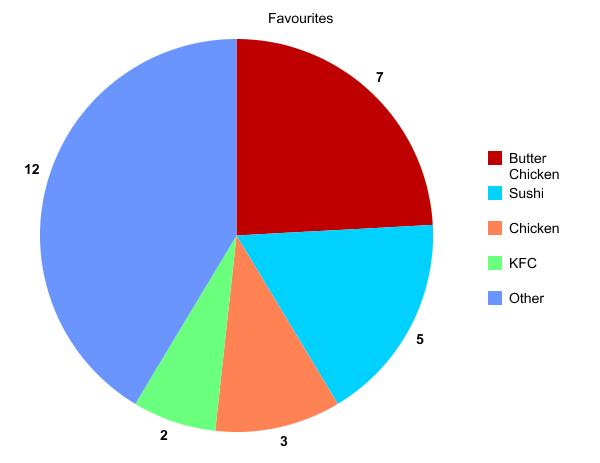
As you can see the most popular food on this graph is other which was noodles, chinese food, Asian food and other stuff like that too. And you can see the less popular food which is KFC.
Here you see a pie chart with all the kinds of favourite food people like. In class 2 we have all made a pie chart to go with our graph too. Here below you can find out all the information of what kinds of foods people like.
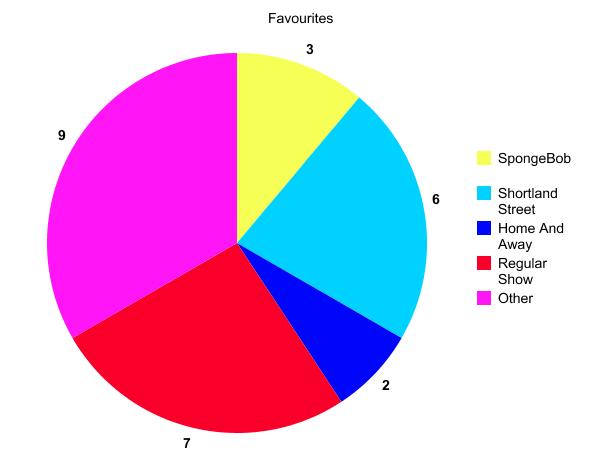
Here there is a Pie chart and a graph. You see the most popular t.v show is other. Here are the other t.v shows that other people liked. There was good luck charlie, Naruto , How to rock , and other more programs too.
Here below you see a pie chart with all the information you need to know. And the least popular t.v show was. I can't believe I have to say this but.... its Home and away. So thats all the information you need to know.

You can see that puppies are the popular animal in class 2. Puppies are quite cute and chubby too. I would love one but I can not have one. But any ways. The lowest pet in class 2 is... a tie between Panda and Leopard. Wow I thought that it was going to be one animal. But turns out its a tie. WHoo No One is lonely.
Down the bottom you see a pie chart with all of the information about what is the popular animal and what is the last and lowest animal is . This pie chart is with all of the 
No comments:
Post a Comment